Unicorn vs. Puma: Round 3
MRI Ruby has gotten a lot faster since I ran my last benchmark, so it’s time for an update.
Methodology
The benchmark consists of hitting a single endpoint on a rails (4.1.1) app in production mode for 30 seconds. The endpoint reads a set amount of posts from a Postgres database and the renders them in a html view using erb, without any view caching.
The purpose of the benchmark to get an idea of the performances characteristics under varying load for MRI and jRuby. Unicorn was chosen for MRI because it uses the unix fork model for it’s processes, which is pretty much the de facto way to do concurrency in MRI. Puma was chosen for jRuby because it bills itself as a very efficient threading server (although recent versions can mix forking workers and threading). Threading is the de facto way to do concurrency on the JVM.
Of course, there are many parameters that can be tweaked in the server configuration. No benchmark is perfect, but I believe it’s a good indication of what type of performace differences can be seen in the two versions on ruby.
Here are the details:
Unicorn
- Unicorn 4.8.3
- Ruby 2.1.2
- Configuration: 4 Workers, Timeout 30 seconds
- Maximum observer memory usage: 450 Mb
Puma
- Puma 2.8.2
- jRuby 1.7.12
- Configuration: Default configuraration (Maximum 16 threads)
- Maximum observer memory usage: 482 Mb
The number of unicorn workers where used in order to match the amount of memory used by puma. In both cases, the observer memory stays below a 1x dyno from Heroku (but not by much).
The benchamrk was run with Apache’s Benchamrking Tool, with varying levels of concurrency:
$ ab -c $USER_COUNT -t 30 $URL
Results
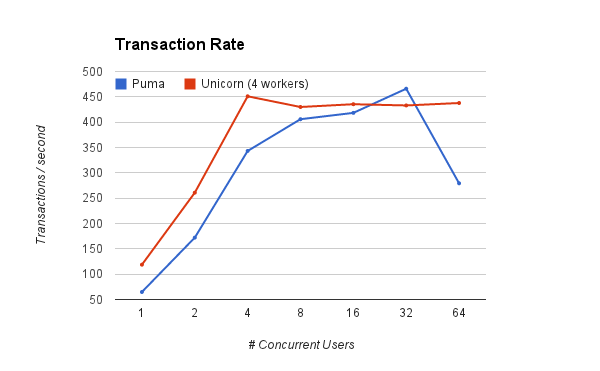
Both servers perform similarly in the number of request they can handle per second. Unicorn seems to ramp up on par with it’s number of workers and then plateau. Even though more users are hitting the endpoint concurrently, unicorn just handles 4 at a time. Puma seems to increase in capacity with more users, although there is a sharp drop-off 1 at the end when reaching 64 concurrent users.
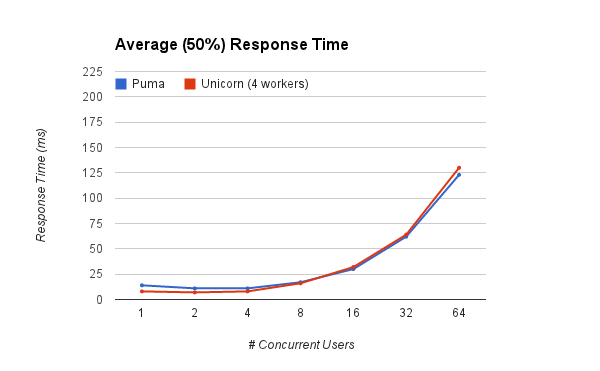
With regards of average (or 50th percentile) response time, it looks like both servers, surprisingly, perform exactly the same!. The response times are significantly slower when the server is under heavier load, but still perform acceptably.
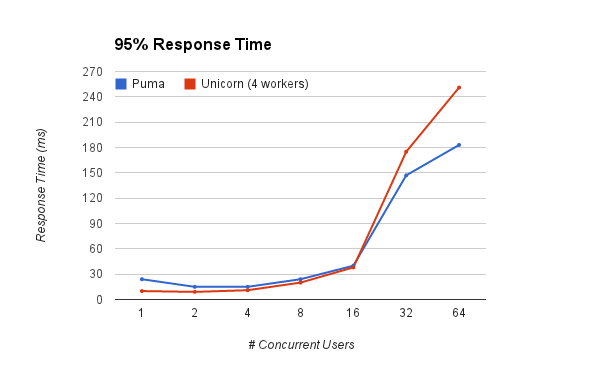
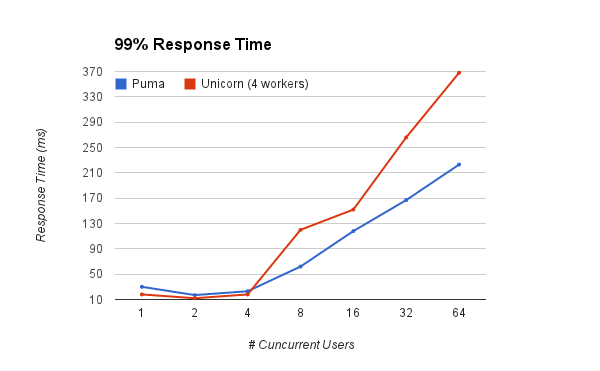
The 95th percentile and 99th percentile graphs paint a different story though: Unicorn’s response time start to get more pronounced as concurrency increases, wich means that for some of the users, it might easily fall into unacceptable levels.
How significant is this? For example, let’s take the 32 concurrent users case: Puma 50th percentile response is 62 ms against unicorn’s 64 ms. Not very different. However, when we look at the 95% percentile puma comes in at 147 ms, wich is 2.3 times the average. Unicorn comes in at 175 ms, 2.7 times the average. Looking into the 99th percentile, puma’s response if 2.69 times the average response; Unicorn is a more dramatic 4.15 times. You should care about percentiles and not just the average response time.
Conclusion
Since the benchmark was last made, MRI Ruby has gotten much faster (last version was running in 1.9.3), however running a Rails app in jRuby still offers some performance characteristics under high load.
-
I do not know what that drop-off means, and it didn’t seem to be there last year. However, I re-ran the benchmark many times, and got consistent results. ↩
Find me on:
- Bluesky at @ylan.segal.family.com
- Mastodon at @ylansegal@mastodon.sdf.org
- By email at
ylan@{this top domain}